Your visit with a qualified office or imaging center is a thorough process. It begins with simple preparation steps that must be strictly followed before you arrive (Pre-Examination Instructions). Once in the office, you will meet with a certified thermographic technician to go over the procedure. A thermography specific intake will be taken and, if you are there for breast thermography, a visual inspection of the surface of the breasts will be done. This is a standard procedure that correlates any surface findings with the infrared images. Once this is done, you will be left for 15 minutes in order for your body to reach a steady temperature state in equilibrium with the special temperature conditions of the room. After this brief waiting time, you will be positioned in front of the imaging system so that the relevant surfaces of the body may be imaged.
The images are captured in real-time from an ultra-sensitive medical infrared imaging camera and sent to a computer for storage and analysis (the images are kept on archival media for comparison to future images for monitoring over time). Specialized infrared imaging computer programs allow the doctor to isolate direct and differential temperatures, perform vascular analyses, dynamic thermal subtraction studies, and more.
Once the images are taken, a board certified clinical thermologist will digitally process and analyze the images. A written report of the results will be sent to you and made available to your doctor.
If you are having a breast thermogram, each breast will be graded using the internationally accepted and standardized TH (thermobiological) interpretation protocol. This is very similar to the American College of Radiology’s BI-RADS grading system, which is used to grade each breast when a mammogram is performed. Each breast’s image is placed into one of five thermobiological categories:
TH 1 – Normal uniform non-vascular
TH 2 – Normal uniform vascular
TH 3 – Questionable
TH 4 – Abnormal
TH 5 – Severely abnormal
Depending upon the results of the exam, further tests may be ordered and/or future infrared scans performed at recommended intervals to monitor the breasts.
![]()
The hotter temperatures are the lighter colors to the right.
In the normal TH1 image above, the color (temperature) patterns of the breasts are cool and very close to identical when compared to each other.
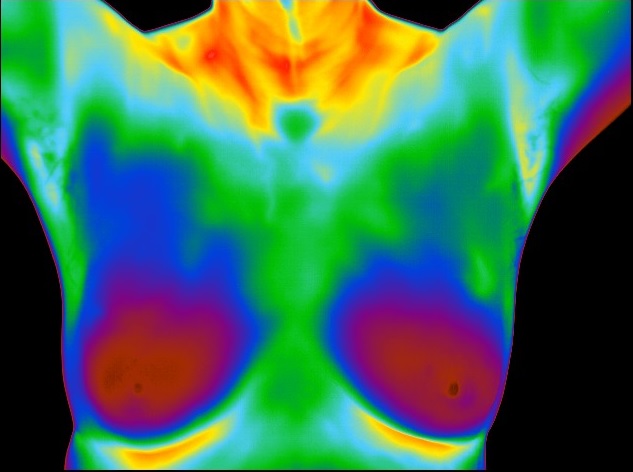
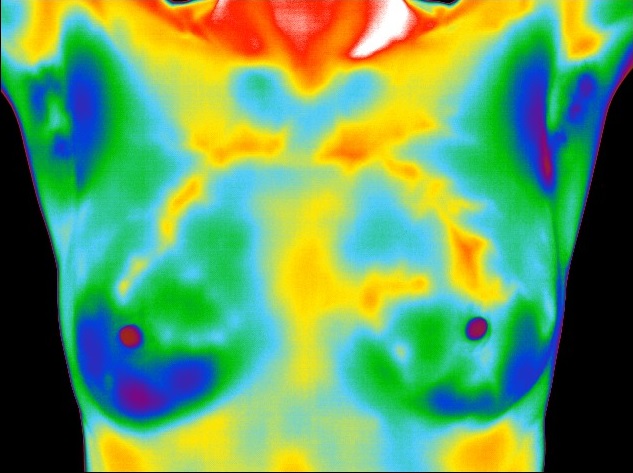
Left and Right Breast TH 2
Both breasts show symmetrical streaks of orange and red (blood vessels). This symmetrical increase in metabolism is commonly caused by the effects of hormones. In cases such as these, the patient is referred back to their doctor for further testing to confirm the findings and determine the cause. The vast majority of these cases are found by the patient’s physician to be a form of hormone imbalance (estrogen dominance). Since lifetime exposure to estrogen is a leading cause for breast cancer, discovering this and correcting the problem may play a significant role in breast cancer prevention.
Left Breast TH 3 – Questionable Image
In the image above you will notice some mildly hotter blood vessels in the left breast. This finding will need to be watched over time for change. If it remains stable, or improves, the finding is normal for the physiology of this patient. Under IACT guidelines, the patient was referred to her physician for follow-up imaging.
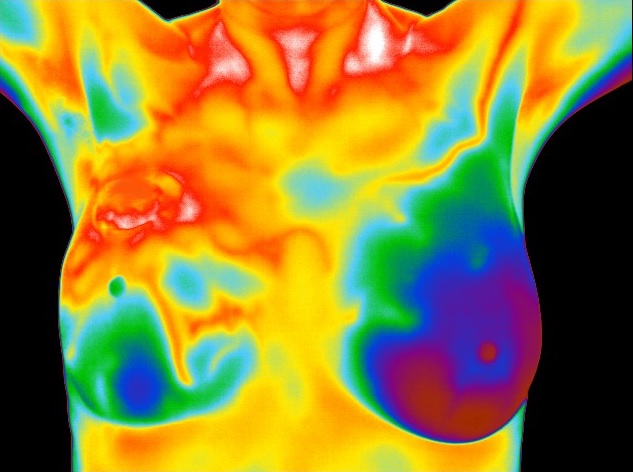
Left Breast TH 4 – Abnormal Image
The image above you will notice the increased temperature and vascularity (metabolism) in the left breast. Under IACT guidelines, the patient was referred to her physician for follow-up imaging.
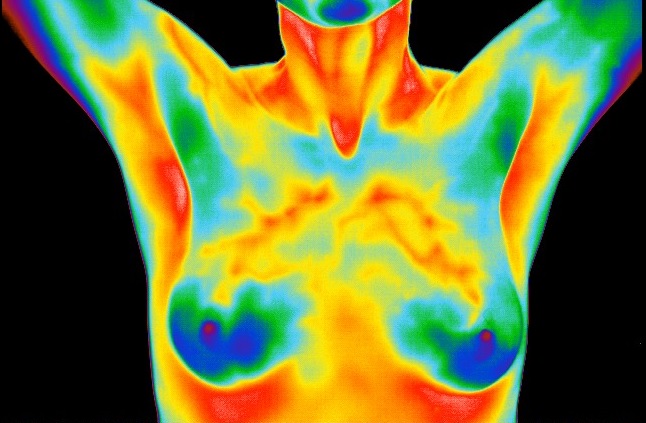
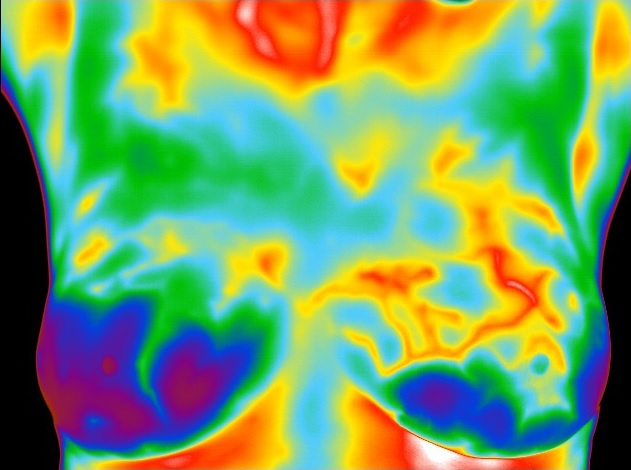
Right Breast TH 5 – Severely Abnormal Image
Note the intensely overall increased temperature and vascularity (metabolism) of the right breast. Under guidelines, the patient was referred to her physician for follow-up imaging.
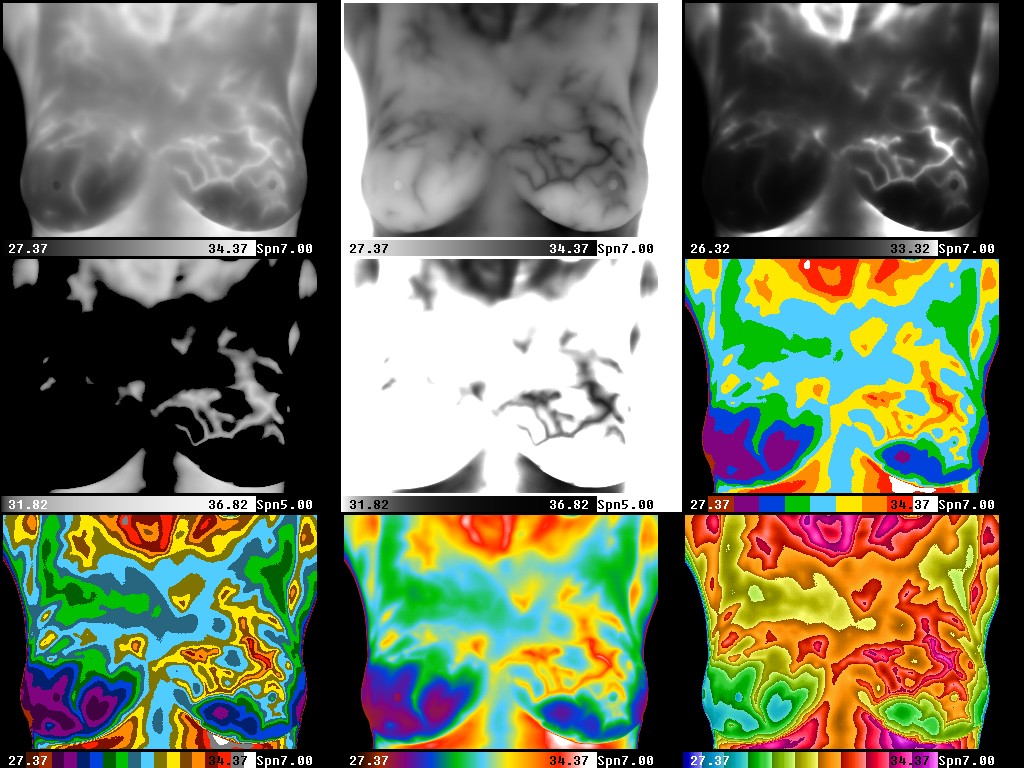
Computerized Digital Processing
The following series of images are examples of a biopsy confirmed case of left breast cancer. The black and white images demonstrate different methods of isolating the neoangiogenic vessels for analysis using computerized digital subtraction processing. The color images are a limited example of the many enhancement palettes available. The type of processing used also provides for computerized quantitative analysis of the temperatures anywhere on the images.